50 Hours to Draw Some Lines
Hand drawing data visualizations with artist Doug MacDowell
Description:
I used to live on a quiet road on top of a huge hill. When leaves were on the trees it felt secluded, and when the leaves fell, the entire city would appear below as sparkling lights. Sometimes, I'd run into a neighbor.
"What are you working on these days?"
"Data visualizations." I told him.
"Ah, you using algorithms, machine learning, cloud computing, things like that?"
"No." I said. "I'm just trying to draw a line graph."
My neighbor thought I was getting into some complex sh**. But what's been more interesting to me lately than using powerbi, powerpoint, tableau, D3, python, illustrator, R is learning to draw data by hand. 50 Hours to Draw Some Lines is about spending more than a week on something that software can accomplish in 20 minutes - and a catalog of resources and methods acquired along the way.
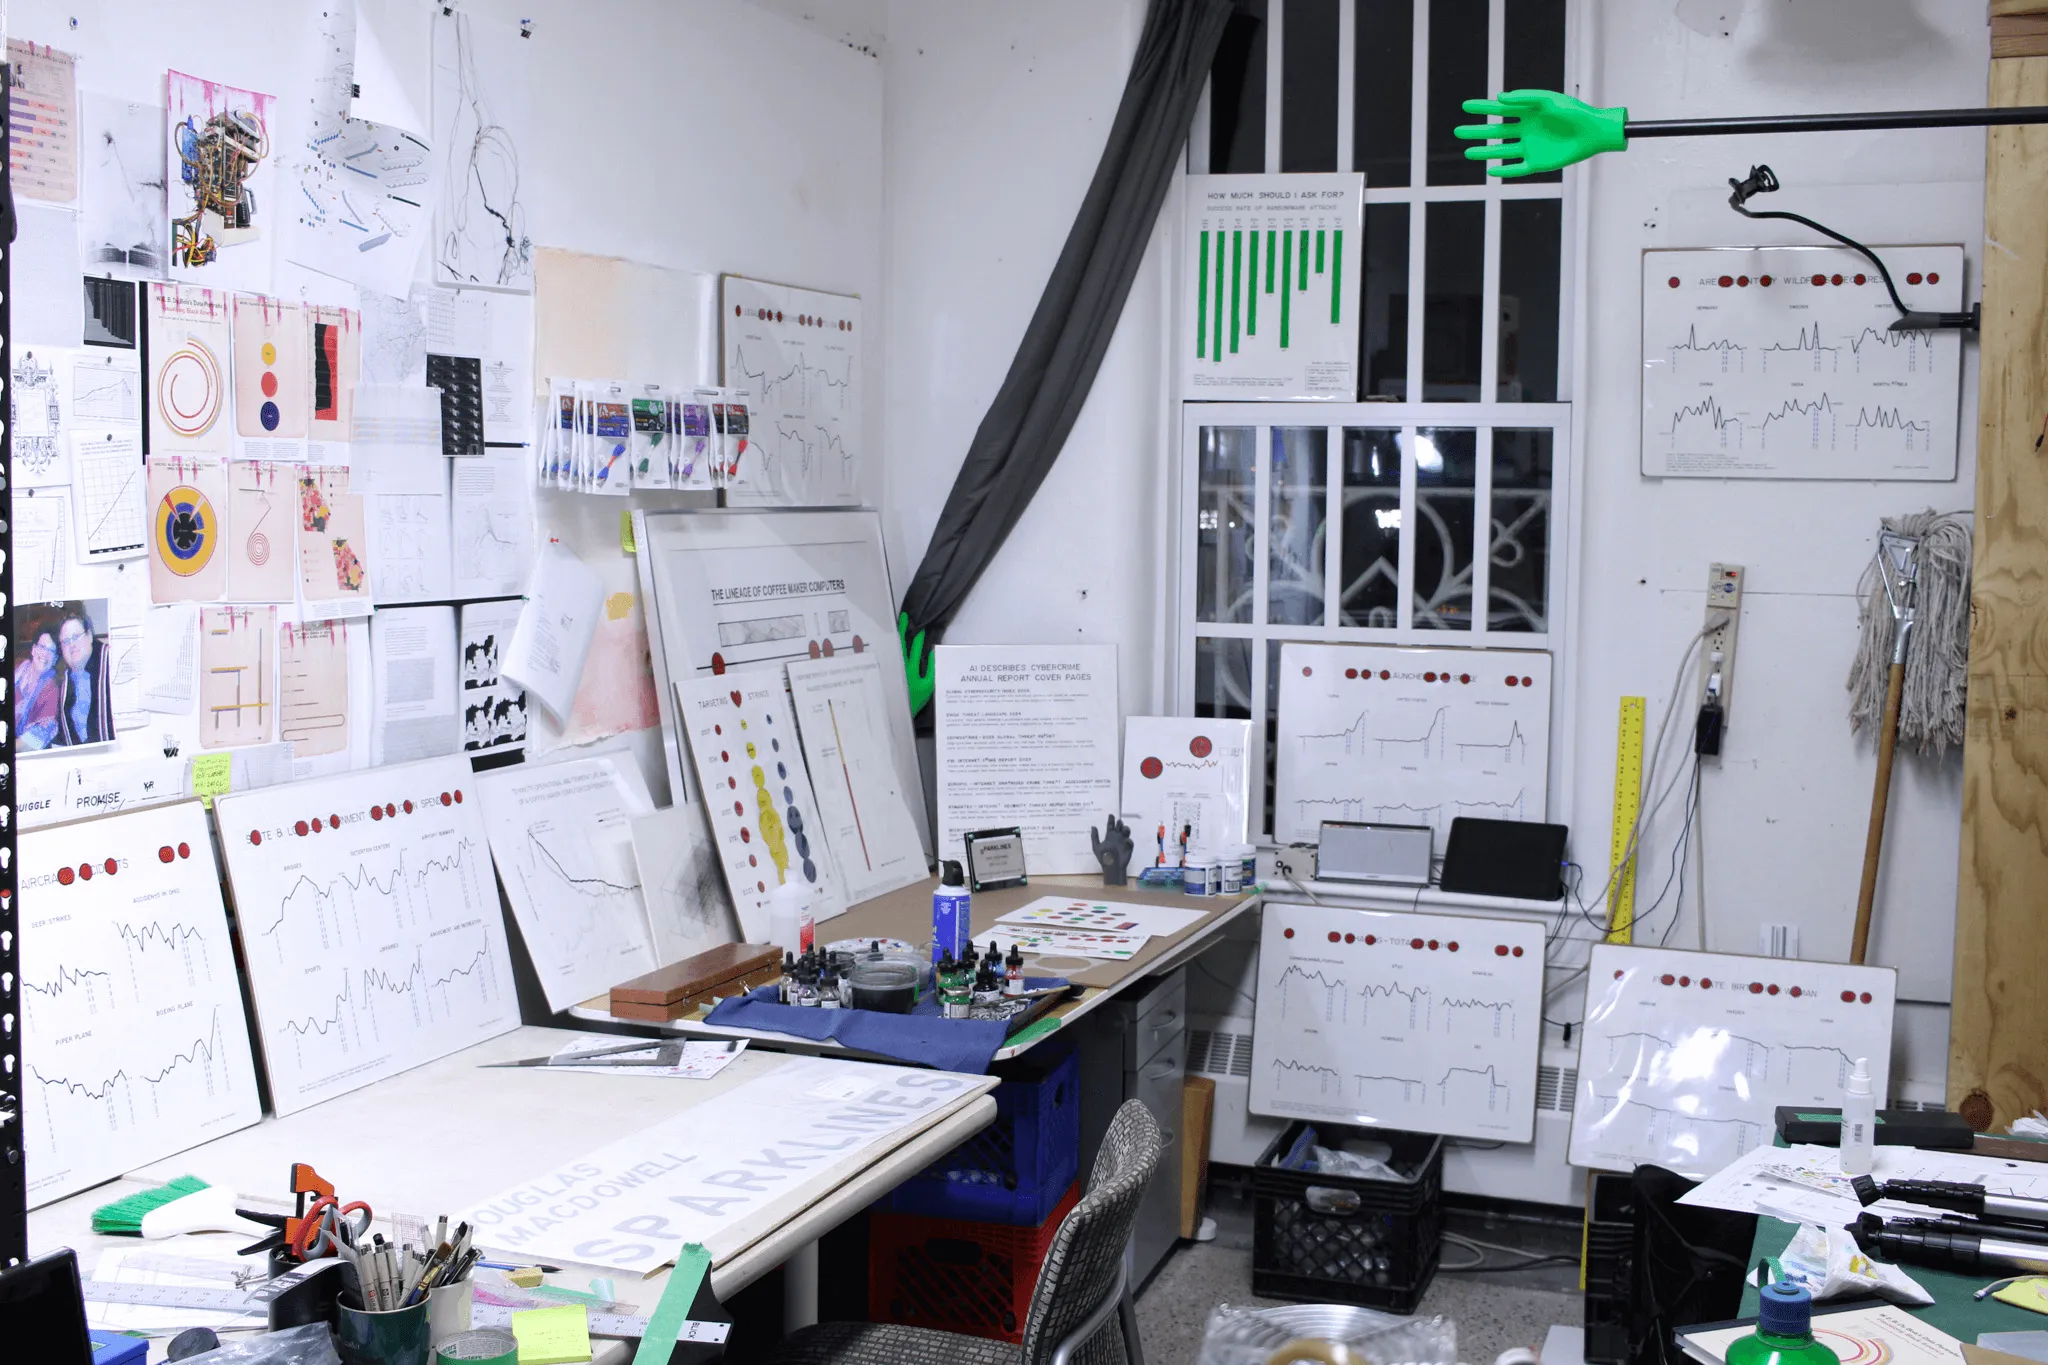
What do I mean by drawing data by hand? I made this data visualization (data viz) about a coffee maker computer by hand, using rulers, pencils, ink, and a lettering kit. Along with my flubs, flukes, and acclimation with tools - it took me 50 hours to make. It's statistically accurate, carefully crafted, and like Hackaday said "right out of a 1970's college textbook". It's how professionals might visualize data before computers could do it for them.
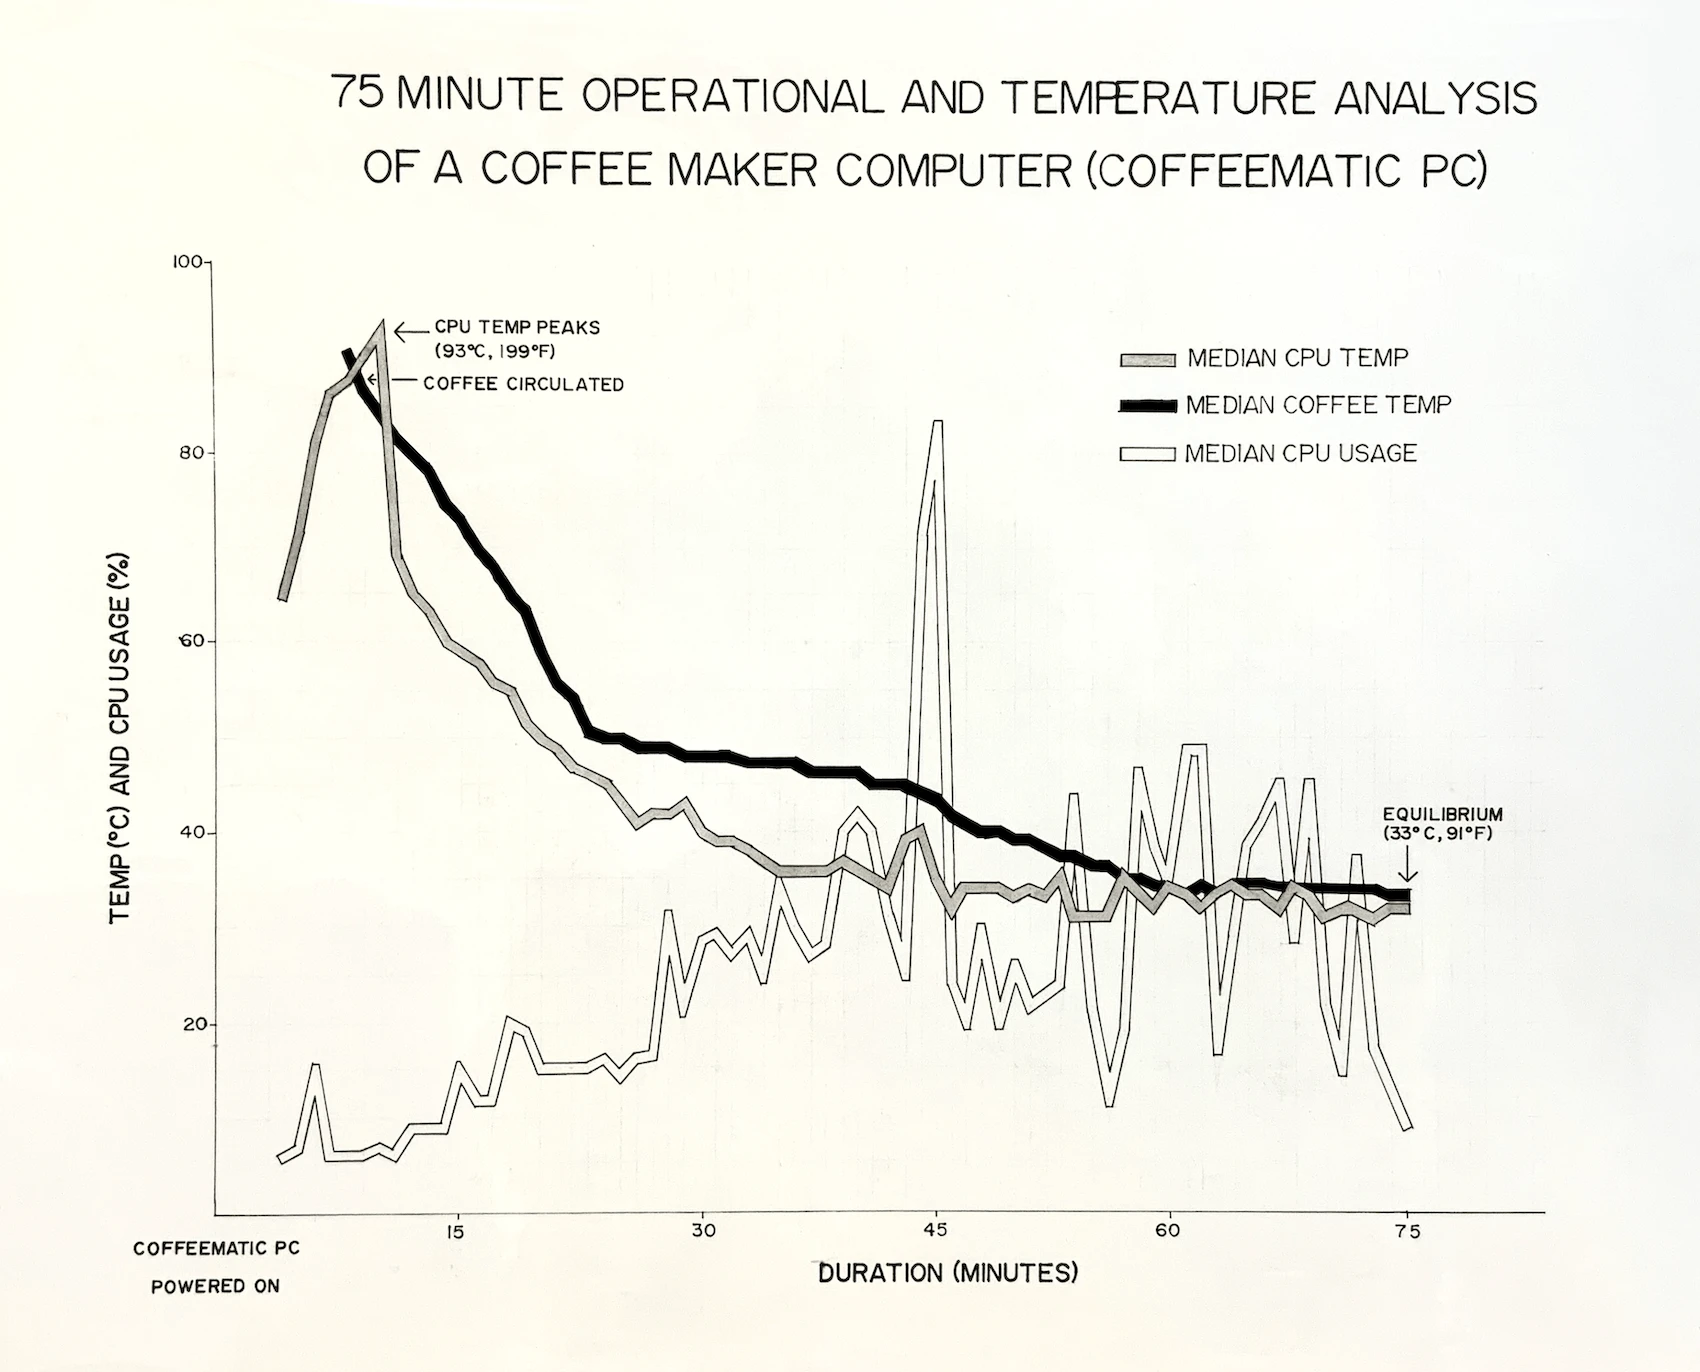
↑ A professional draftsman of the 1920's may cringe at the imperfections in my line graph above. They can suck it.
There are books about hand drawn data viz, and these are my favorite. Nearly all are available online for free, and can be referenced for instruction/inspiration. Tufte's book sucked me in and spit me out as a hardcore data viz enthusiast. Dubois' sociological and artistic experimentation are my favorite to revisit over again. Williard Brinton's book from 1914 smells awesome (it's in my collection). And William Willard's instructions are blunt and to the point - I bet he was a cool shop teacher.
- The Visual Display of Quantitative Information - Edward R. Tufte - 2001
- W.E.B. Du Bois's Data Portraits - Whitney Battle-Baptiste, Britt Rusert - 2018
- Graphic Methods for Presenting Facts - Willard C. Brinton - 1914
- Graphic Presentation - Willard C. Brinton - 1939
- A Practical Course in Mechanical Drawing for Individual Study and Shop Classes - William Franklin Willard - 1910
- Charts and Graphs - Karl G. Karsten - 1925
- Engineering Drawing - Frank Zozzora - 1953
- Freehand Drafting for Technical Sketching - Anthony E. Zipprich - 1924

↑↑ Is this artwork by Jiří Lindovský a data viz? Is it a narrow skyscraper? A Cheez-It? CPU? A line graph? ... Whatever it is, this drawing was made using the same techniques covered here. By learning to hand draw data viz, you can also learn about art. In fact, this whole thing is really about making art. One of the best parts of art, is playing with tools.
These are the basic tools and materials needed to hand draw data viz...
- Paper - smooth bristol is best, 14 x 17 in. or larger
- T-square - provides a level guide for your drawing
- Ruler - it's important to have a measurement tool
- Drawing board - I use cement board from a hardware store, at least 3 x 3 ft preferred
- Painter's tape - must-have for holding paper and t-square down, I like the wide variety
- Pencils - a classic mechanical BIC is my favorite
- Pens - most anything works, I like Micron pens
- Eraser - erasing graphite to reveal crisp ink lines is a special thing, Staedler erasers are great
- Triangle - slides along the t-square, used to draw vertical lines and angles
- Circle stencil - very important tool, this is used to create consistent line weights
- Ink - this one with a spider person is my favorite
- Lettering kit - not required, but a very fun vintage tool to create nice lettering

To start a hand drawn data viz, begin with a grid. Drawing a grid is not only a necessary first step, but a calm, mindful process to enjoy while becoming comfortable with the tools. Practice by positioning paper on the drawing board using the t-square as a level. Cut a long piece of tape and wrap it around your torso and spin around 3 times (the fuzzies from your clothes help avoid the tape sticking too much to the paper). Then place the tape horizontally across the top edge of the paper, holding it in place.
Adding margins is always a good idea and will establish the workspace. If the paper is 20 x 24 inches, measure one inch in on each side. Using a pencil, t-square, ruler, and triangle, draw some margin lines. The new workspace is 18 x 22 inches. Keep going, using a ruler, make a mark every inch on the margin lines and using the straight edge tools again, make lines at each mark. There are now 396 squares mapping out the workspace. Call it a night, or divide the squares even more, and draw more lines. Everything done to create hand drawn data comes back to this grid. In the end, all the pencil lines will be erased, revealing the most satisfying, clean, crisp inked lines imaginable. But we're not there yet.

When I started, I thought I'd use a fat marker like a Sharpie to draw the lines of my line graph. That doesn't work. It's nearly impossible to create a quality line with the stroke of a pen alone. I needed a way to control the weight of the line and cleanly connect every data point accurately. I found that the best way to make a professional, proper data line, is to use circles.

↑ Using a pencil, plot data points onto the grid with a small dot. Grab a circle stencil and create a circle around each dot - this sets the line weight. With a debit card (or a small ruler), connect the outer edge of one circle, with the circle next to it. It's surprising how intuitive this feels while seeing the lines begin to form. I like my connector lines to overlap slightly, letting me control the style of line joins (miter/bevel/round).
↓ A while back I was walking alone in an alleyway when a large, off-leash rottweiler appeared and stared me down. I felt scared. Thankfully, the rottweiler was interested in something else and went on his way. At this stage it's time to use ink, and it can feel scary. (carefully) Trace over the connector lines in ink using a pen. Like how the rottweiler left and my fear relieved, the same feeling happened here. At this point, I reward myself with a treat, and give one to the rottweiler too.

Using an eraser and a light touch, begin erasing the pencil marks near the lines. The ink should stay in place, the pencil lines disappear, and endorphins surge from the brain. Coloring in the lines with a pen or paint brush is the last step to finish the lines of the graph. But! Lines are just part of a data viz. To make it complete a few final touches are needed.

A debate among artists is whether or not to sign their work. Alphonse Mucha prominently signed much of his work, but his signature is almost hidden in his most monumental paintings. Data viz guru Edward Tufte (aka ET) believes a vivid display of authorship is essential. Marcel Duchamp signed a urinal.
Signature or not, the choice of text elements is important. Text can be added free-hand, or with a tool called a lettering kit. When I bought my lettering kit I didn't know what all the little pieces were that came with it. If some were missing from the kit would it matter? Definitely. The small metal pieces are reservoirs and nibs. The reservoir holds the ink, and the nib sits inside the reservoir, controlling the ink being let out. They are different sizes and need to match. These need cleaned out after each use - soap, water, tooth brush, and computer duster did the trick for me.

Adding a title, axis labels, annotations, and authorship (if you choose) are the final elements needed to finish the hand drawn data viz! The remaining pencil marks can be erased, leaving only ink. I found that I actually like leaving some pencil marks from the grid as an artifact of the process, and a clue that this is something made by hand.
At this point, I sit back and enjoy my hard work.

I don't live on a quiet road on top of a huge hill anymore. I actually live downtown in a city and my life and work are quite different. I query databases that have gathered data for a long time - this is sometimes complicated work. Like many people, I can't spend my time drawing data. However, my time devoted to hand drawing data has left me with a question that wonderfully impacts me each time I think about it...
Why did I spend 50 hours making something that PowerPoint could make in 20 minutes?

edit: This article was discussed on Hacker News with lots of comments.